

Could your website be working harder for you?

Contentsquare released their 2025 benchmark report last month and it makes for fascinating reading. First off, let’s start with the data – benchmarks are only as good as the sample size it looks at. For Contentsquare, the data is impressive and includes
The headlines are, largely, unsurprising, but do provide compelling evidence to invest in the experience you provide your customers.
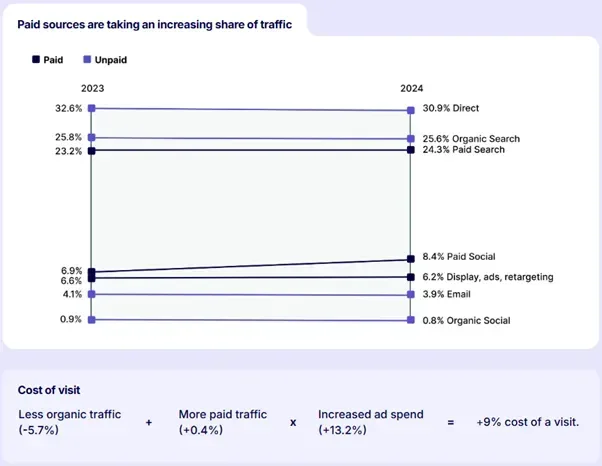
We’ve previously seen that total marketing budgets as a percentage of a brands revenue continues to fall. This is compounded by the fact that paid traffic as a percentage of all traffic increased – up a modest 0.4% year-on-year but now reflecting 39% of total site traffic. At the same time, unpaid traffic is one the wane, with a decrease of 5.7%.
All of this comes together to mean that the cost of a visit increased by almost 10% year-on-year and 19% over the past two years. The value of a visit has therefore never been as valuable
Key takeaway 1: Organic search only saw a modest decrease YOY but with the increase in LLMs and Google’s AI Overviews, making sure your focussing on SEO is critical. There’s less real estate to go after, so the best practices of great site experience, understanding your customers and what they search for and providing content that is authoritative and trustworthy is vital.
Key takeaway 2: Given each visit is more expensive than it was last year, maximising the value you get is the way to drive online growth.
Amongst some of the noteworthy observations here are that consumption is down 6.5% - a pretty chunky figure from one year on the next. This covers pages viewed, time on site (down 4.6% on its own!) and scroll rate and you could attribute to the broader notion that attentions are less easily held than in previous years.
But what was particularly interesting was that product detail pages (PDPs) landings are up 3% and product listing pages (PLPs) saw a 10% decrease in landings. This is something we see in our own web insights projects, and what we also often find is the performance of PDPs in general. We have consistently found that users who land on the PDP have a lower conversion rate compared with traffic that doesn’t land on a PDP but later lands there. Although intent and marketing channels are key factors there, the question we always have is: was the PDP designed to be a landing page?
Key takeaway 3: Review where your users land – is it where you expect? And if you do have a large proportion of traffic landing on PDPs, how can you adapt those pages to make them a smoother landing experience? For example, do they address key user concerns or questions – whether it’s shipping, returns, USPs, or something else.
Barriers to conversion are everywhere – tackle them!
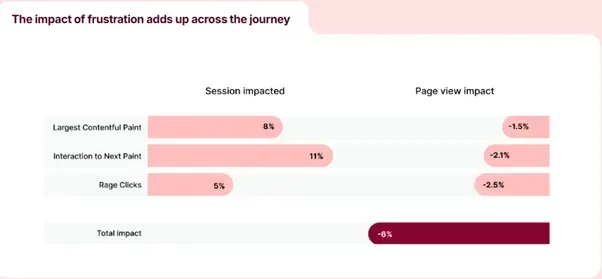
One of the positives was that sessions which experience “frustration” – defined as any point of friction and include Javascript errors, slow page loads, rage clicks, etc – has fallen YOY. However, 40% of sessions include some element of frustration and the impact of frustration is clear. Pages loading slowly leads to 1.5% fewer pages viewed. Rage clicks lead to 2.5% fewer page views.
And more broadly, conversion rate is in decline. Whether that’s looking at new vistiors, returning vistors, paid social visitors or all traffic – conversion rates are down year-on-year between 6-12%.
One of the most interesting observations was that brands that managed to increase pages per session by 10% or more actually reverse that trend, and saw an increase in conversion of 5.4%.
The implication is clear – focus on building an experience that functionally works, that engages users and prioritises building a rapport, rather than attempting to simply rattle through the checkout process as quicky as possible.
Key takeaway 4: Try to understand how conversion rate looks for different cohorts of visitors on your site. Do you have everything you need to understand their behaviours, their needs?
Key takeaway 5: What are you doing to test and personalise experiences on your site? Are changes being made without being validated? Are you tying together messaging from ads to landing page to reduce friction
With lots to digest and lots of figures to review, it can feel overwhelming to know where to start. We would recommend:

