
Comprehensive guide to the standard reporting options in GA4
Oliver Walker | 5 June 2023

Start at Home
Home is as good place to start as any…but in reality, there’s not a lot to say here. Other than – here’s a quick way to dig into:
- Very top-level headline stats around users, conversions, events and sessions – which you can change the date range on, but otherwise customisation is limited
- Recently accessed reports
- Some suggested cards, most of which you can change the date range on and some you can tweak either the dimension, metric or both
- Some auto-generated insights
It’s nice and all, but not a place you’ll spend any time.
GA4 reports – the amuse bouche
These are your default reports and as I’ve previously written about, there’s some nice features.
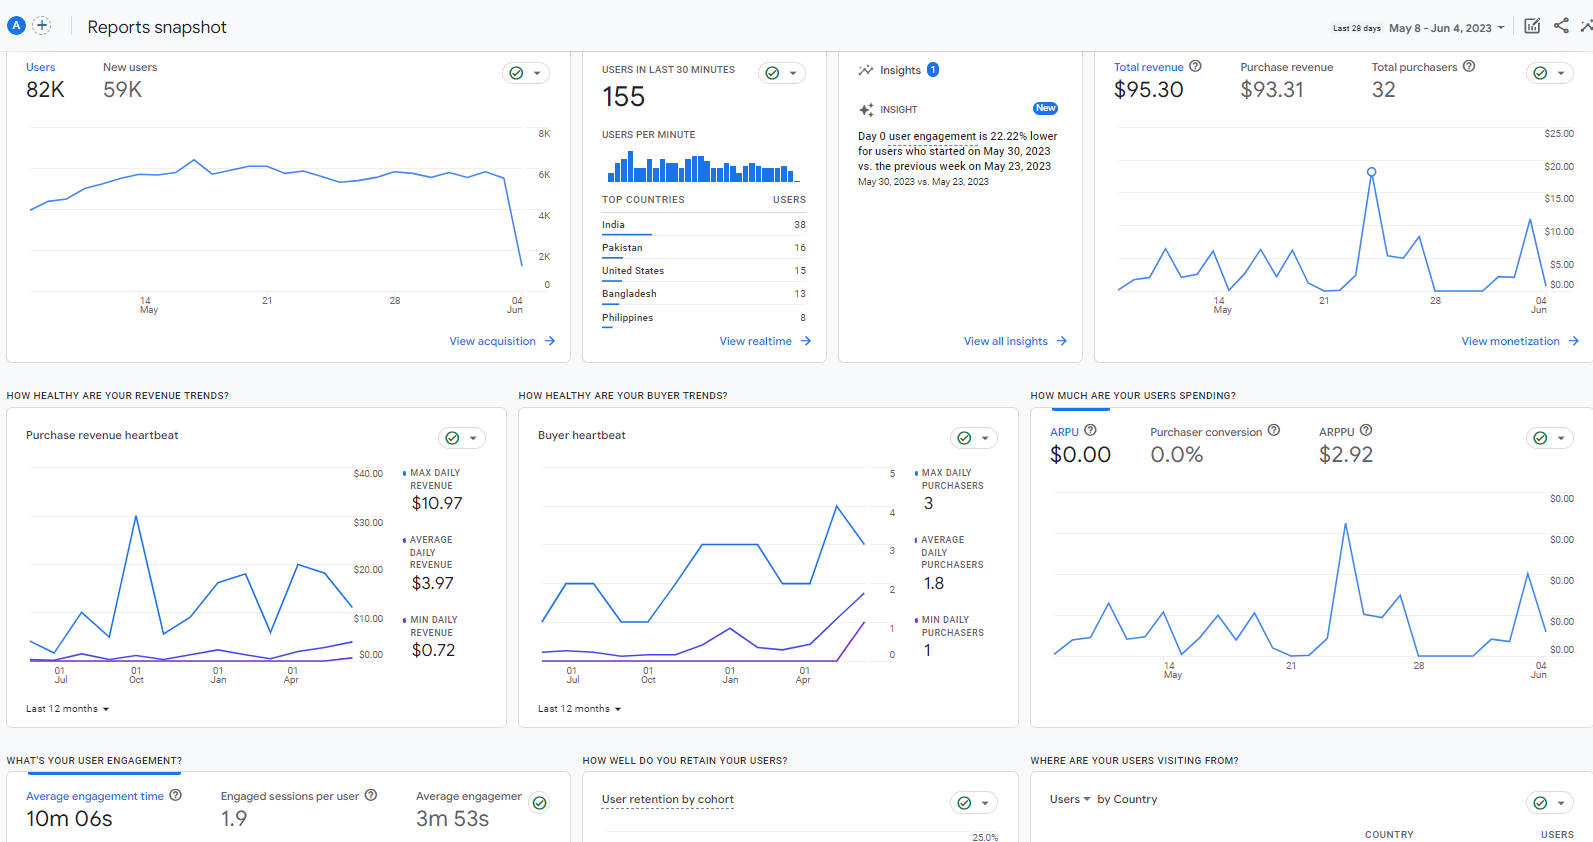
The first report is similar to your Home page, and is the Reports snapshot. Unlike the Home page, you are able to customise this to be more useful for you. You’re able to do things like:
- Add, remove or edit cards
- In terms of editing, you can play around with both metrics and dimensions
- You can also apply comparisons (like segments) to slide the data for different groups of users
Again, this is very much a semi-useful dashboard which allows you to jump to more detailed reports
You’ve also got the Realtime report, another returning friend from UA. Similarly to the snapshot, you can edit some card’s metrics and apply comparisons but it’s fairly limited in it’s use, except for double-checking campaign tagging and to ensure nothing catastrophic has happened. In years gone by, I knew of organisations that had a screen up around the office with Realtime continually on, just in case something on the website broke, it’d often be the quickest way to know.
These reports act a little like a salmon blini – tasty, getting you interested but not enough to satiate you completely.
The main course – customising the Collections and reports within GA4
A lot of time spent in Google Analytics 4 will be using the standard reports, although the experience is much improved once you’ve customised the reports and the navigation to your liking.
Within each section of the main reports, you have:
- Overview reports – a series of cards similar to Reports snapshot. Like that reports snapshot, you can do all the same things in terms of customisation
- Detail reports – typically a couple of graphs and a table. As per tables in UA, you can add a second dimension, filter the table (based on either primary or secondary dimension but not by metrics), add more rows to your table or cycle through pages
There’s also a bunch you can customise including:
- Changing the primary dimension, e.g. from Session Default Channel Group to Session Source / Medium.
- Change the metric with which the report is sorted by
- Add / remove metrics, or change the order of them in the table
- Add a filter to the whole report, e.g. a given channel
- Create new cards
- Change the name of the report. This is useful if you don’t like GA4’s default naming convention and is something we’ll come onto shortly
For example, as you’ll see in a little while, we have done a couple of things in the Hookflash account:
- Customised the default Traffic acquisition report to show just PPC, giving us a PPC acquisition report, as this is an important channel for us
- Customised the Landing Page report by just showing SEO, giving us an SEO Landing Page
- But there’s lots you can do here. Filter for certain pages, channels
With everything you customise in the Reports section, you’ll get the option to “Save changes to current report” or “Save as a new report” (exactly like you would with a Word doc for example). Opting to “Save as a new report” is a quick way to access views of the data that you want, without doing that customisation each time (more on that later!)
Just bear in mind that whilst changing the primary dimension, adding a secondary dimension or tweaking metrics IS retained when you customise a report in this way, filtering tables IS NOT. So if you want to look at a report for just mobile traffic, or just UK traffic, use a Comparison instead.
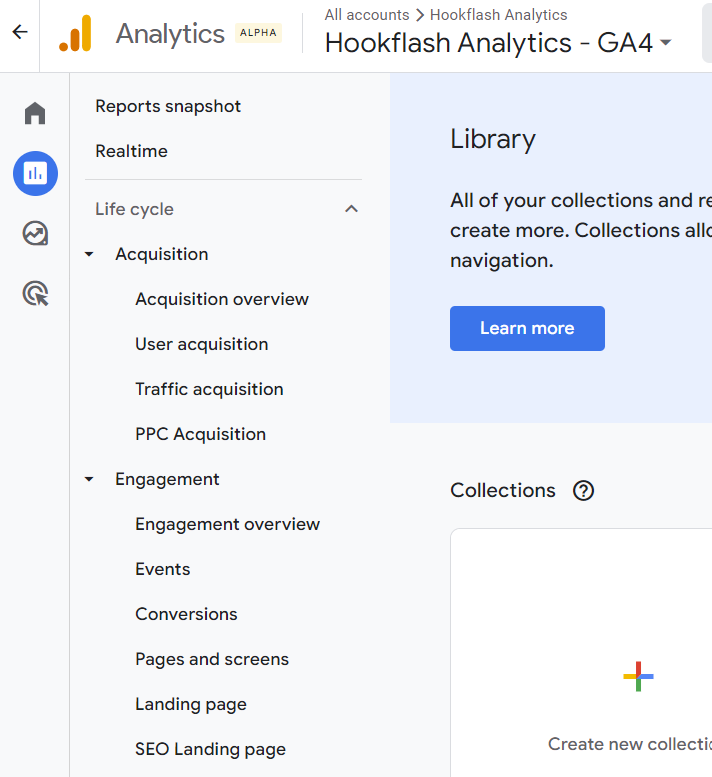
GA4 Library feature – make some noise (pun intended)
To be able to quickly access views of the data you want, you need to make use of the Library feature. This is where all of the content that lives in Reports is housed – both what you’ve built (by customising an existing report or building a new one) and the default reports.
Libraries have two sets of assets:
The first is called Collections – these are the groups of reports as you see them on the lefthand navigation menu. By default you’ll see “Life cycle” is the first Collection within which there are folders for Acquisition, Engagement and Monetisation. These folders are known as Topics.
Within the Library, you’re able to change the name of the Collection template itself, reorder and rename topics and reports, or remove reports. If you have customised or renamed an existing report, as we discussed above, here is where you’re able to add that new report into the navigation for your property. As with the reports themselves, you have the ability to Save changes to current collection (i.e. to publish whatever changes you make) or save as a new collection if you want an additional collection or you’re just not ready to publish yet.
For example, in the Hookflash Analytics account I created a PPC report within Acquisition (above) and an SEO Landing Page report within Engagement (below)
You’re also able to create a new Collection or Topics (of reports), or publish / unpublish existing Topics. If you choose to create a new Collection, you can see there are a handful of pre-built templates, including Search Console (if you’ve integrated that with GA4) and Games Reporting (if you’ve got an app-based game and want to understand user engagement and acquisition). Again, you can see for Hookflash we’ve both enabled Search Console reports and added a new Topic

The second asset within Libraries are the Reports themselves – this is where you can choose to build either Overview or Detail reports from scratch, save them, and add them to a topic or Collection to be published.
Customise to suit you
By taking the time to consider what you and other key stakeholders are going to be looking at regularly, you can really shape the navigation to be more intuitive, and helpful, to all. Whether that’s just renaming reports to make them more user friendly or creating a number of easy-to-access reports that show you exactly what you need, there’s plenty to do.
If you’re struggling or just want to chat, give us a shout!
Want to have a chat?
Chat through our services with our team today and find out how we can help.


